This isn’t Luhmann’s zettelkasten

Compare Luhmann’s hierarchical, threaded system with typical graphs produced by note taking apps in the pics below.

It seems Luhmann’s system would promote a different way of thinking; developing threads of thoughts strung together, perhaps like a story. Whereas “linked notes” is just a scattered, but linked, mess.

I suppose preference for one or the other might come down to the purpose of taking the notes. Luhmann was a prolific author and scientist. His writing probably benefited from a more hierarchical and linear structure. Whereas, if you’re just trying to find your instructions for resetting the Wi-Fi password on your door lock, a more graph-like view might be better.

This is something I’ve been pondering for the month since this post on twitter by Winston.

Is one “better” than the other? Maybe a mix of the two? Use a table of contents note and transclusion to “linearize” notes in a graph?

Would appreciate any thoughts.

Luhmann


Graph of my notes, but typical

5 Likes

This is one reason I have generally not cared about any sort of visualization graph feature. They almost always look like yours, and I fail to see any sort of benefit.

Oddly enough, this is the first time I have ever seen Luhmann’s system visualized.

10 Likes

I believe you could be overstating the difference. When writing books or articles, Luhmann would check notes across branches, pull the relevant cards and then create an overview rearranging them on his desk. Luhmann even wrote that it’s not important where the note is placed in the Zettelkasten.

If you check the Luhmann archive online, it’s clear that the the purpose of the so-called “Luhmann-ID” was to give each card an address (so it could be found later) and not to create hierarchy or develop a reasoning by chaining ideas.

This blog post is very insightful: Understanding Hierarchy by Translating Folgezettel and Structure Zettel • Zettelkasten Method

3 Likes

I don’t know (or care, to be honest) if you’re write or wrong about Luhmann. But what I will say is the rush to remove all hierarchy is stupid — if you’re the sort of person who needs hierarchy to quickly find things.

I do. Hierarchy is invaluable for me. And it’s not incompatible with linking.

3 Likes

From my opinion, those Graphs are completely worthless, unless you are producing a YT-Video, to promote your expensive course about Notetaking.
BUT, the linking behind those Graphs, are likely the system Luhmann would have used, if he already could.
If you use a physical Zettelkasten, you are looking at one sheet at a time, and then go to the next one. And nothing else is it you are going to do, if you have for Example Notes within Obsidian, that are linked together. The todays benefits are less in the linking of some notes within the same Thought (you could also just create a folder, and place the notes one by one underneath each other into this folder), but in the faster search and reference. And also in linking notes of different Thoughts together, as Luhmann partly did by referencing to other areas of his Zettelkasten, or even duplicating some of his notes.

2 Likes

Ah but as mentioned how they are stored is not how his cards were used. And in the Obsidian graph the way it’s drawn as a circle changes how you see the links but the local graph gives a different view of individual notes. The assumptions on how the links repel or attract also affect the view.

I have several table of contents notes that then have transcluded pieces but the graph view doesn’t show them that way it still shows like a cluster around the base TOC note. Now if I included a next and previous link like some peple do it does show up linearly. I only next and previous once i’ve defined the things I’m writing about to the point that it is fairly stable and also only when it really matters what order things are read in. A book may have next and previous links that point to th previous and nest chapters for example.

I use the graph feature fairly often. I use it to find notes that are unlinked and are eitehr candidates for deletion or for adding into the sytem in a more robust way. I also use it to see larger clusters that may need refinement. Often a very dense cluster has some redundancy in the data and can be simplified. I do those tasks when I am looking and discover that I have several notes very similar all linked together but that could be refactored into a more consise version(s) I wouldn’t see that as easily without the graph view to help me locate those notes.

I also use hierarchy a lot. I know where in my system to go to to find stuff. What linking does for me often is theif the first place I look didn’t haveht enote I wanted, once I find it I then go back and put a link to that note in the place I first looked. Over time I get a mesh where no matter my mindset I can usually find specific notes in my pile of thousands with one click.

4 Likes

Great conversation!

I don’t know if Luhmann’s methods are necessarily worthy of the hero worship they receive. He had some neat approaches and, perhaps partly due to those approaches, he produced a lot of good stuff. (Or so I’m told.) I’d bet, though, that the key reason we talk about Luhmann’s methods for knowledge innovation is that he made it easy for us to talk about them because he had interesting artifacts (the slipbox) and he talked about his system.

I imagine we’d talk about the Oprah method or the Kahneman approach just as much if those folks ever put their “workflows” together in the same nice package Luhmann happened to.

Still, I suppose that that’s a tangent, so I will make these paragraphs <small>

The key practice that Luhmann engaged in (the one that gets obscured by the focus on the artifacts he used to do this) is the thinking that went into linking each piece of a chain to other parts of the chain. He either got really good at “chunking” knowledge due to this workflow, or he created this workflow because he was really good at chunking knowledge. :chicken: :arrows_counterclockwise: :egg:

That chunking — that deep, productive reading, questioning, and relating — is the best way to “learn” new concepts (see chapter 4 of Oakley’s A Mind for Numbers for more on this).

Because he did it so systematically and with such discipline, he was truly, deeply engaged in these concepts, which made it easier for him to keep doing it, which made him do it more, which made it easier to keep going… you get it.

The cards and the indexing and so on are all artifacts that facilitated this process, but I think they were secondary to his productivity. The design principle here is to find ways to thoughtfully chunk and relate the pieces of knowledge you’re working with. The tech(nology/nique) you use to do that doesn’t really matter (although there are doubtlessly options that make this easier or distract you from it)!

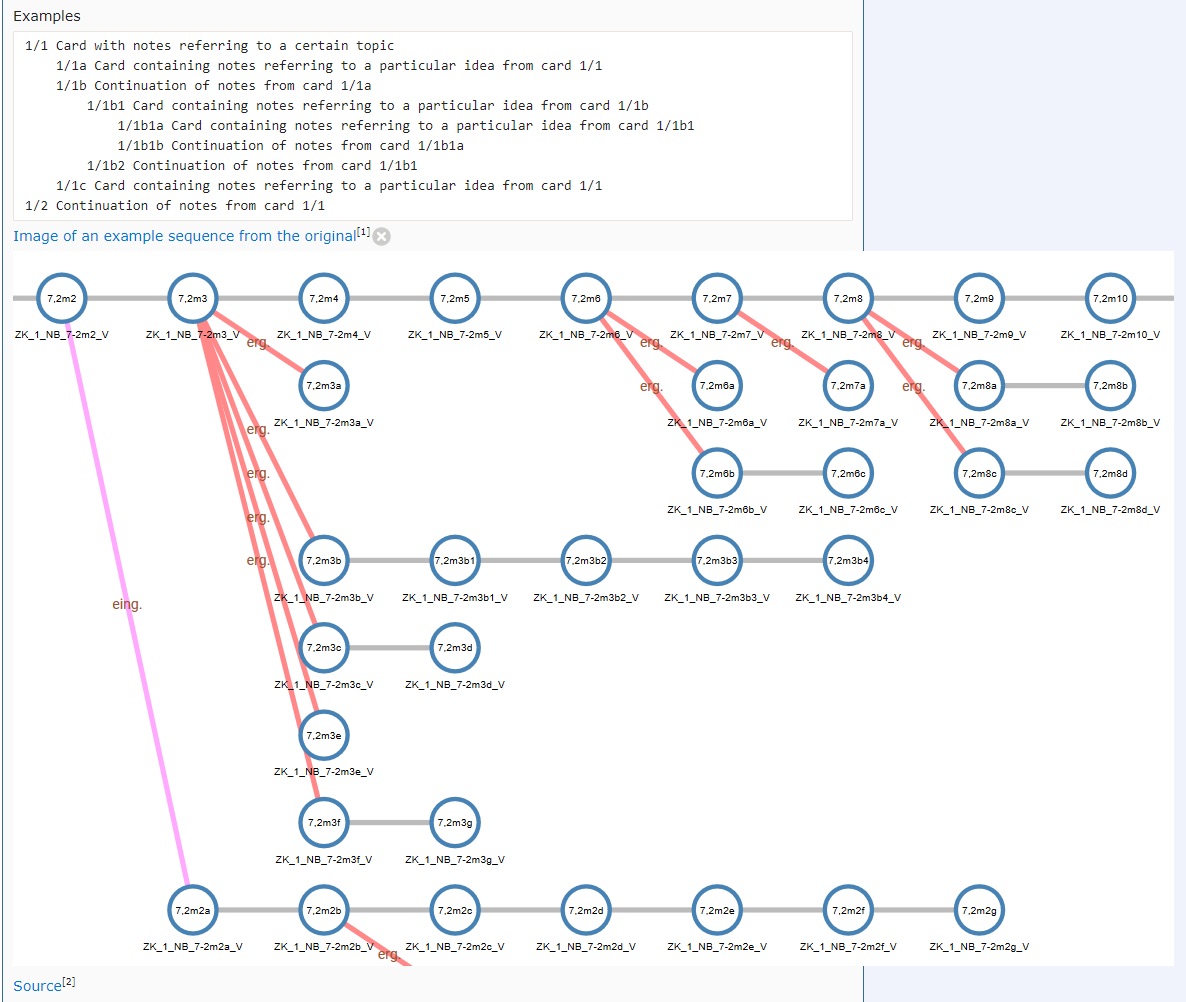
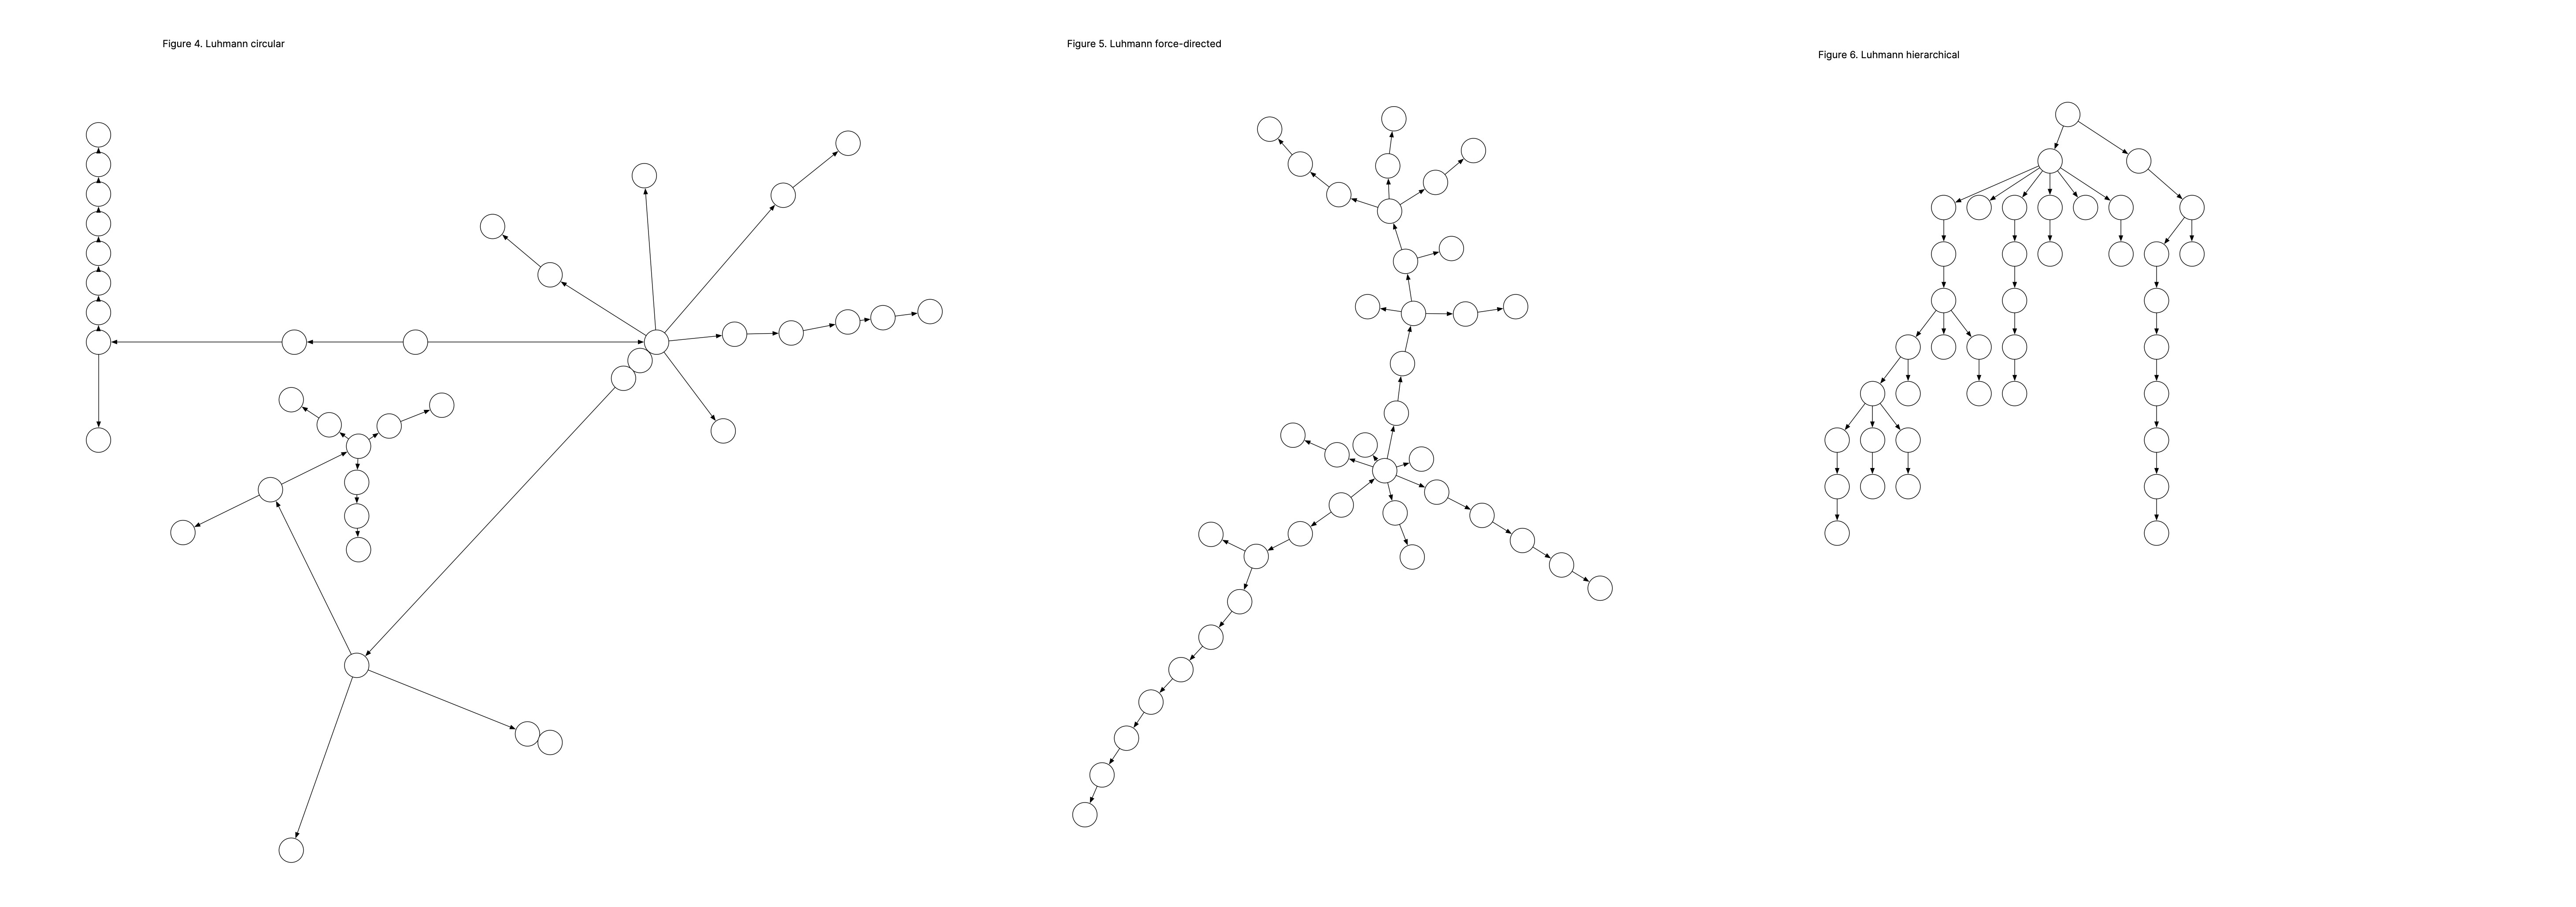
A final point-of-information: graph-wise, the only difference between the two images below is that one is laid out hierarchically while the other has a circular layout. From a graph theory perspective, they’re the same kind of structure: (mostly) acyclic directed graphs.

The first is more sparse than the latter, which could be attributable to the core question of the thread, but that isn’t necessarily the case.

To explore this a bit more, I remade the Luhmann demo graph in OmniGraffle and then reorganized the graph three times using the app’s auto-layout features:

(sorry for the size; doing this quickly and Discourse keeps getting mad at me. :frowning:)

Again, great conversation. You’ve highlighted a very interesting and potentially valuable tension @JohnAtl!

9 Likes

I agree with you. This has been discussed previously on the zettelkasten forum. I share the opinion that a graph view is not necessary and just “linking notes” isn’t going to do anything helpful unless that connection has a more profound meaning and is explicitly conveyed.

1 Like

Totally agree @ryanjamurphy - great post

The biggest mistake I see is that so many people think they need to duplicate someone else’s method. We all think/process/read/write differently. Look at lots of data points of other systems and then figure out what works for you.

6 Likes

Hmmm. I don’t know enough graph theory to argue. But none of Luhman’s nodes branch to more than one upstream and one downstream node; there are no cross links between branches. I’m pretty sure that isn’t the case with the circular graph (not because it’s circular, I realize).

I can tell some things just from looking at this static image. The outer clusters along the top and sides connect to themselves a fair bit, but not to the main bill of the graph, implying that they are relatively discrete topics; the clusters in the south, so to speak, are still distinct, but more interconnected with one another and the main cluster, which is itself highly interconnected.

That actually tells you something about the relationships among topics; if we knew what the general topics represented by the clusters are (as the author surely does) it would mean even more.

Cluster graphs like this can be extremely informative. All that said … I don’t use a graph view of my notes.

Luhmann was using physical notecards, which would have exerted an influence on the patterns of links in his system:

  • Each card is a finite size, so when he reached the end of the card and still had more to write on the subject, he had to get another card, which probably contributed to the linear chains of notes.
  • Compared to a software-based system, linking requires much more effort, especially links to cards that were physically distant from the one he was working on. Again, this seems like it would encourage short, linear chains.
3 Likes

Good point; that accounts for the sparsity of the Luhmann graphs.

Technically they are a subset of directed acyclic graphs: rooted trees, or more specifically an arboresence. These are graphs in which there’s only one path between any two nodes, and those paths move outward from a “root”.

The question then becomes… if you constrain your note-making process to only result in (directed, rooted) trees, does it improve knowledge management/innovation performance?

1 Like

I guess the answer is yes if your thought process resembles Luhmann’s. I do not have to give much thought to the fact that I am not wired like that :smiley:

Also interesting: if Luhmann had access to these new “linking your thinking” tools, would he be doing the same process, or would he come up with something different?

1 Like

Luhmann had a system that apparently worked for him. YMMV. It would be a good, if extremely complex topic for interdisciplinary academic research to uncover the effectiveness of linking methodologies and note contents. I doubt we’ll come to a conclusion here!

Effectively Luhmann created a mindmap in card form, with the key advantage that he could reorganise at will. Obsidian (for example) creates a complex web of interconnection. I’ve no idea if that actually helps our first brain.

Two centuries earlier Jonathan Edwards used “miscellanies”… topic based interlinked notes. The key difference with Luhmann was the length of the uniquely numbered entries in his notebooks which could be anything from a paragraph to several pages of developing thought. For some this might be preferential to atomic notetaking. The notes were cross referenced with each other and with his Bible (he wrote in the margins) and other primary sources… backlinks included :slight_smile: .

1 Like

I also think that, independent from Luhmann, it’s most important to find workflows/techniques that work for oneself.

And similar to @ChrisUpchurch I think that the medium which Luhmann used (small physical notecards) directly influenced his method. So he might well have used different method(s) today.

Also, as mentioned, it’s possible to combine the approaches: If you find out that you benefit from more hierarchical notes where individual notes follow a linear thread, then:

  1. use a structure/overview/TOC/MOC note which organises individual notes into a hierarchical order
  2. link individual notes together with “next” links (or, if possible, typed links like [[followed by:...]])

In any case, always give each link enough context (i.e. why does this link exist?). This should give you a good basis going forward, no matter in which direction you decide to go. And if the added context is structured enough, you could easily move from one approach to the other later on.

1 Like

I am In total agreement with this sentiment. Authors Robert Greene and Ryan Holiday are possibly the closest in terms to how the method was actually implemented, and they both use physical cards that they lay out and constantly arrange to make sense of - and connect - in a Visio/spatial way and both reap tremendous output because of this.

2 Likes

Holiday documented his process while writing Discipline is Destiny.

2 Likes

Thanks for posting this. His video was an inspiration to me as I work on my book, much appreciated!

2 Likes

Good observation… which is perhaps a limitation of (current) digital systems. I can use a mindmap to visually observe notes and connections… but it’s not the most obvious tool to rearrange and connect the nodes/cards.

Obsidian allows me to make many to many links, but again it is hard to view them in a visual way that also supports rapid rearrangement. The graph simply gives you historical connections.

2 Likes

An option is Scrivener’s Note Card feature—it seems to me if would be ideal for this.

1 Like